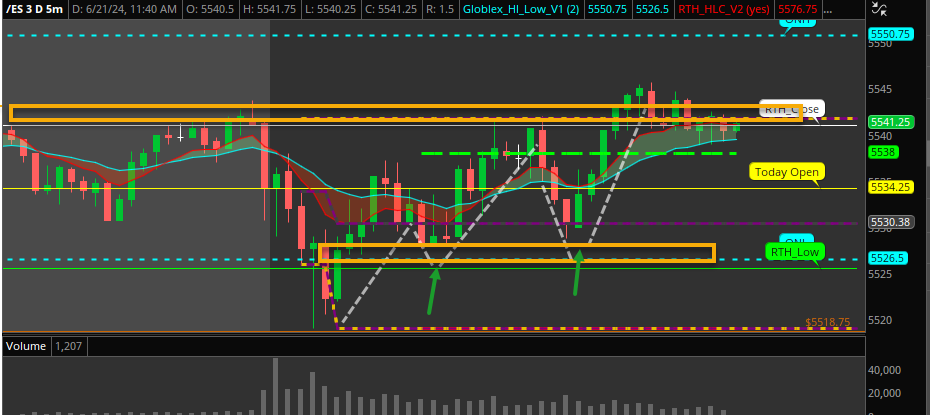
ABC pattern
The ABC pattern is a common concept in technical analysis used by traders to predict market trends. Let’s break it down
ABC pattern
The ABC pattern is a common concept in technical analysis used by traders to predict market trends. Let’s break it down:
- A (Initial Peak): The stock makes an aggressive move to an extreme pivot point.
- B (Trough): After the initial move, there’s a pullback and consolidation.
- C (Final Peak): The price forms a higher low and grinds up, breaking through the morning high. This pattern often signifies more potential in the direction of the larger move. Keep an eye out for it on intraday charts! 😊
How do you measure?
Fibs…
Questions
- What % of the time are they perfect symetry?
- What other pattern they lead too?
- How to rationalize when you see other patterns like double-bottoms, wedges, flags as part of ABC?
- Which patterns should you consider?
- How to guage how high they can go?
- When to reset the ABC and take next trade?
- Is it best toke ABC when supported by Supply and demand?
- Risk management?

Examples
Find live examples.
This post is licensed under CC BY 4.0 by the author.