Supply and Demand - AMZN
Techniques for identifying and drawing supply and demand zones for AMZN.
Let’s Break Down AMZN!
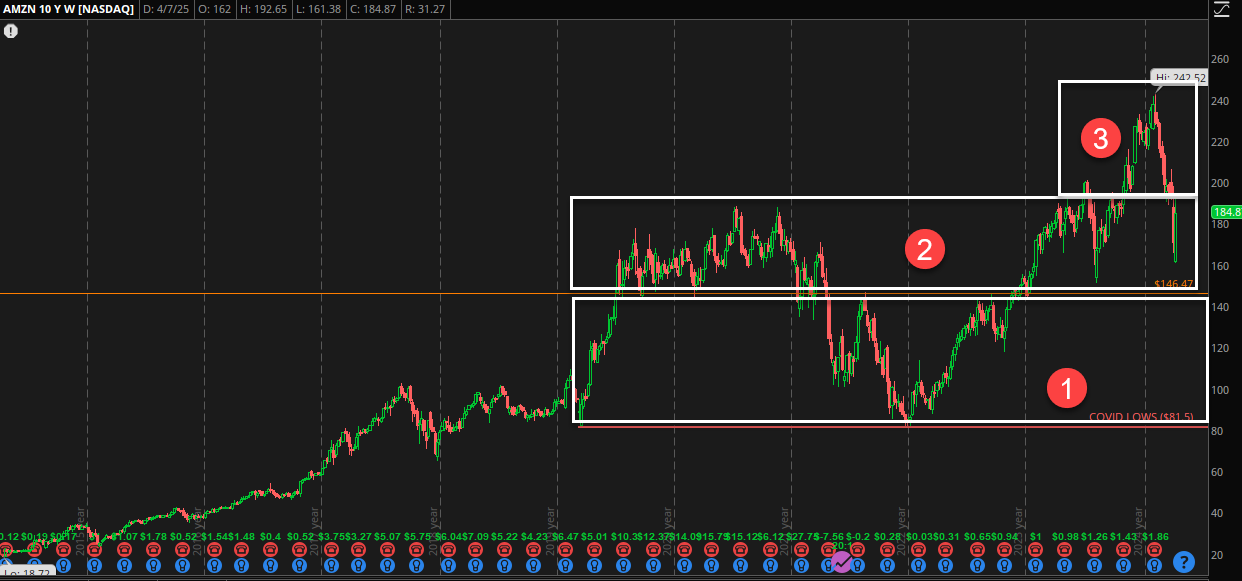
1. Identifying Three Key Price Clusters
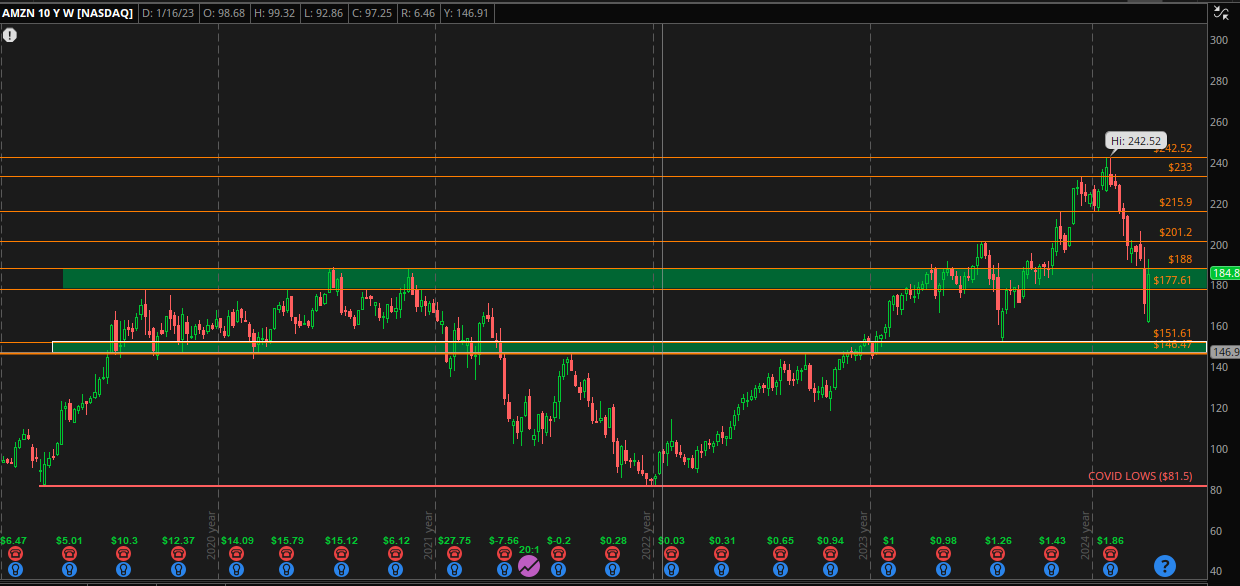
2. Using the Weekly Chart to Identify Zones and Levels
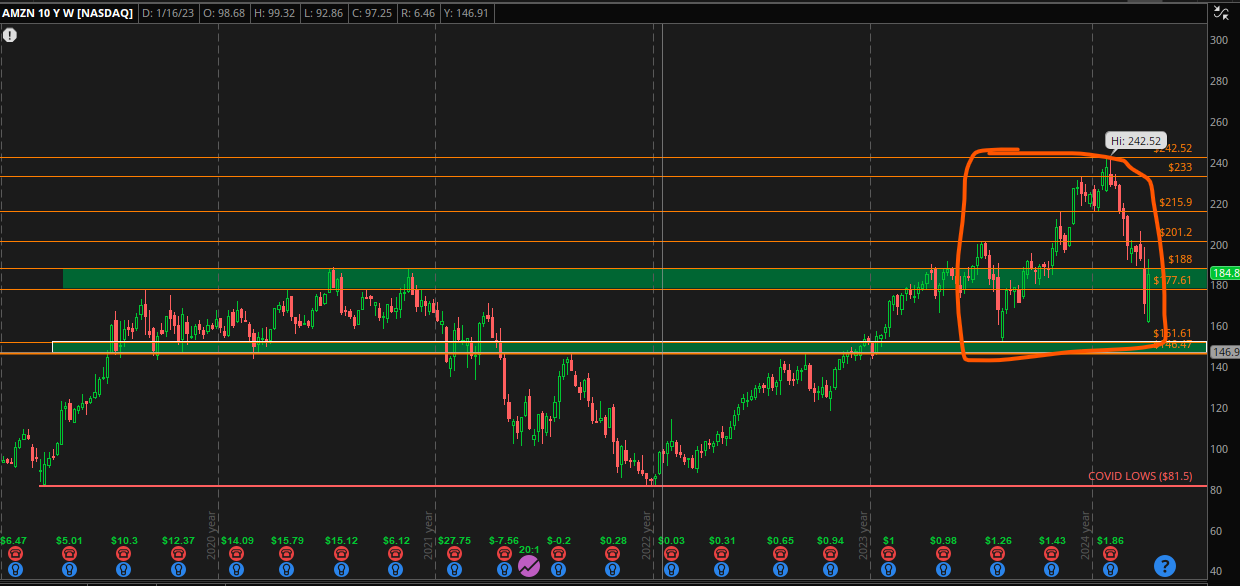
3. Focusing on the Current Price Action Area and Switching to the Daily Timeframe
4. Adjusting Zones and Levels on the Daily Chart with a Focus on the Current Price Area
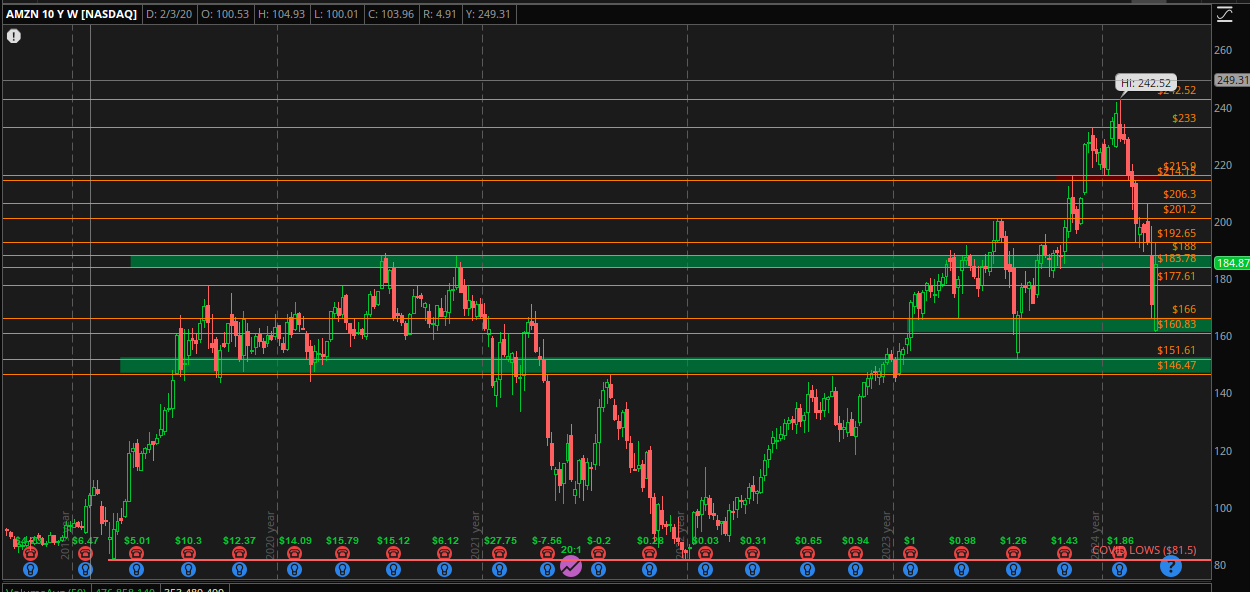
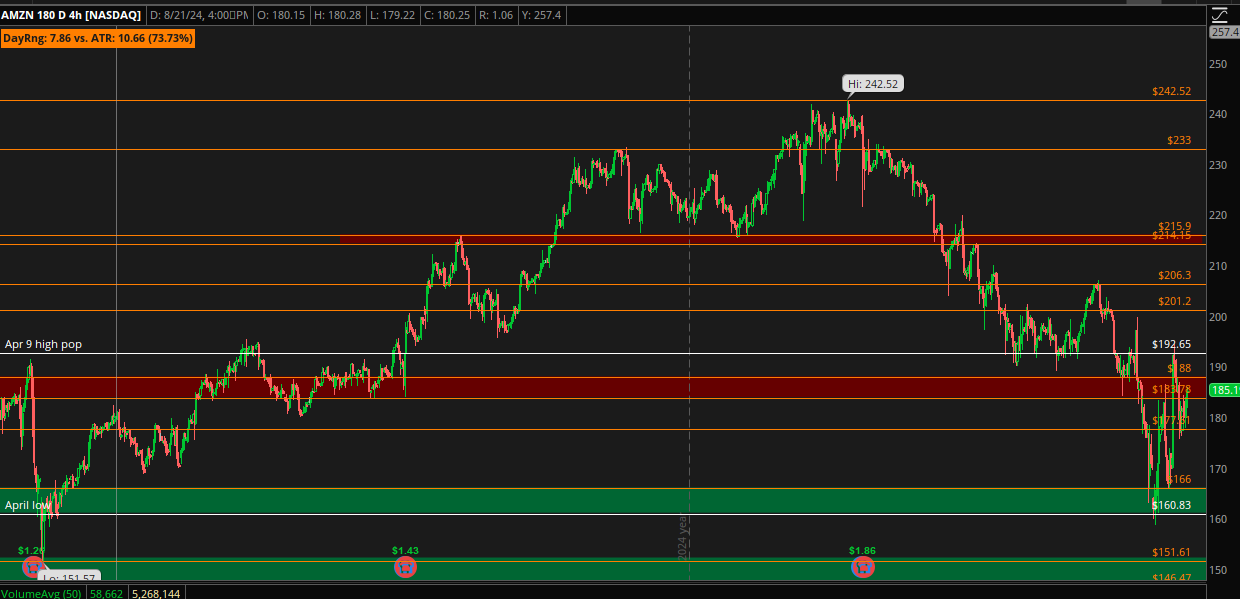
5. Considering This Week’s Price Movements and Adding Final Levels. After applying all the changes, here is the final chart. This is a 4-hour view of the adjustments (note: the 4-hour chart was not used for plotting).
Conclusion
By following the steps outlined above, traders can effectively identify and refine supply and demand zones for AMZN. These zones provide valuable insights into potential price movements and help in making informed trading decisions. Always remember to validate your zones across multiple timeframes for better accuracy and reliability.
This post is licensed under CC BY 4.0 by the author.